The mistake we see most often is assuming that the Hobart City Council’s minimum seismic demand, based on AS/NZS 1170.4, accounts for local site effects. It does not. The code gives a generic sub-soil class but ignores the actual shear-wave velocity profile beneath your footing. We have analysed sites in the Derwent estuary where the amplification factor at 1.5 Hz was double the code value, because 8 m of soft alluvial clay overlies weathered Jurassic dolerite. That mismatch directly increases drift demands on braced frames and can push a 4‑storey building into a different ductility category. The only way to capture this is through in-situ geophysical measurements, such as the MASW-Vs30 survey, combined with a site-specific seismic amplification analysis that integrates local geology with the Hobart-specific strong-motion records from Geoscience Australia.
In Hobart’s Derwent estuary, the amplification factor at 1.5 Hz can double the code value because soft alluvial clay overlies dolerite.
Methodology and scope
- Vs30 profile via MASW (AS 1289) and HVSR microtremors for resonant frequency.
- Strain-dependent modulus reduction curves (Darendeli 2001) for nonlinear response.
- Peak ground acceleration (PGA) scaling from the 2018 National Seismic Hazard Assessment for Hobart (0.08 g for 500‑year return period).
Local considerations
Hobart sits on a mix of Quaternary alluvium along the Derwent and weathered dolerite on the hills. The dolerite itself has high Vs (900–1,200 m/s) but it is often capped by 5–15 m of colluvium and residual clay. During the 2013 Tasmania seismic swarm (M 3.5–4.0), instruments recorded ground motions 1.6 times higher on the alluvial plain than on the dolerite ridge at the same epicentral distance. Ignoring this differential amplification means buildings on the flat can experience 40 % more drift than those on rock, even at the same PGA. We combine the amplification analysis with a dynamic slope stability model for sites on the foothills where topographic amplification can also occur.
Applicable standards
AS/NZS 1170.4:2007 (structural design actions – earthquake), AS 1289/D4428M-14 (MASW testing), AS 1726:2017 (geotechnical site investigations), NEHRP Recommended Provisions (site class definitions)
Associated technical services
MASW-Vs30 Profiling
Multichannel analysis of surface waves along 2–4 arrays per site. We produce a 1D shear-wave velocity profile down to 30 m, classify the site per AS 1170.4, and provide strain-compatible modulus reduction curves for SHAKE modelling.
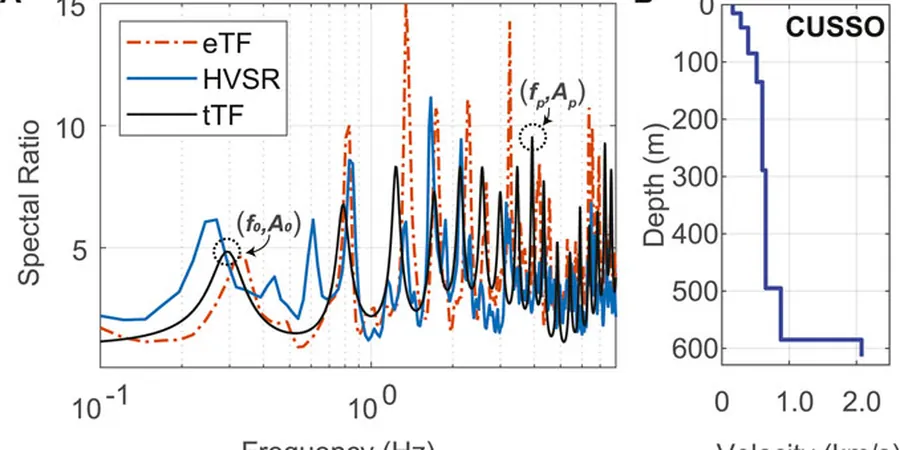
HVSR Microtremor Measurements
Horizontal-to-vertical spectral ratio using a three-component seismometer. We measure the fundamental resonant frequency of the soil column (f₀) and the corresponding amplification factor. Ideal for distinguishing deep alluvial basins from shallow dolerite sites.
1D Equivalent-Linear Site Response Analysis
We run SHAKE or DeepSoil with input motions scaled from the 2018 NSHA for Hobart. Output includes acceleration response spectra at the surface, spectral acceleration ratios, and drift demand curves for the structure. Report includes comparison with AS 1170.4 code spectra.
Typical parameters
Frequently asked questions
How does the seismic amplification analysis differ from the standard AS 1170.4 site classification?
AS 1170.4 assigns a generic site class (A–E) based on soil depth and average SPT N-value, but it does not account for the actual shear-wave velocity profile or the frequency-dependent amplification. Our analysis uses measured Vs30, resonant frequency (f₀), and strain-dependent modulus reduction curves to compute a site-specific response spectrum. In Hobart, the code often underestimates amplification on the alluvial plain by 30–50 %.
What is the typical cost range for a seismic amplification analysis in Hobart?
For a standard 1D equivalent-linear analysis including MASW field work, HVSR measurement, and a detailed report, the cost is between AU$1,730 and AU$2,970 depending on site access, number of arrays, and required turnaround. Additional shallow boreholes or SPT testing would increase the scope and cost.
When is a seismic amplification analysis mandatory for projects in Hobart?
It is not mandatory under the National Construction Code, but the Hobart City Council may request it for buildings over 15 m tall or for sites with known soft alluvium (e.g., along the Derwent foreshore). We also recommend it for any structure where the structural engineer has identified a potential period mismatch between the building and the soil column.